Menu
Stored procedure execution info with query plan
By Lori Brown | Expert
Sometimes it is good to have some queries in your toolkit that give you information on how things are running that includes the actual execution plan. While looking at Glenn Berry’s diagnostic query scripts (http://www.sqlskills.com/blogs/glenn/sql-server-diagnostic-information-queries-for-september-2015/), which are very good btw, I found queries that will list stored procedure statistics but none had the execution plan included. So, I decided to make a query that will list stored procedure run statistics for the database you are connected to with the execution plan for the entire stored procedure included. This can be helpful if you are looking for resource intensive or long running stored procedures that may need to be tuned. Of course, if a stored procedure’s plan is aged or flushed out of the cache you may not see it. However, if you know when a stored procedure is likely to run you can catch the execution plan with this query shortly after it has completed.
NOTE: On very busy instances, this query can take a while to run.
SELECT OBJECT_NAME(procstats.object_id) AS proc_name,
— execution plan
qplan.query_plan,
— total stats
procstats.execution_count,
procstats.total_logical_reads,
procstats.total_physical_reads,
procstats.total_worker_time/1000000.0 AS total_worker_time_sec,
procstats.total_elapsed_time/1000000.0 AS total_elapsed_time_sec,
— last stats
procstats.last_execution_time,
procstats.last_elapsed_time AS last_elapsed_time_microsec,
procstats.last_elapsed_time/1000000.0 AS last_elapsed_time_sec,
procstats.last_logical_reads,
procstats.last_physical_reads,
procstats.last_worker_time AS last_cpu_time_microsec,
procstats.last_worker_time/1000000.0 AS last_cpu_time
FROM sys.dm_exec_procedure_stats procstats
CROSS APPLY sys.dm_exec_query_plan (procstats.plan_handle) qplan
WHERE procstats.database_id = DB_ID()
AND procstats.type = ‘P’ — SQL Stored Procedure
— AND OBJECT_NAME(procstats.object_id) = ‘Your proc name’
ORDER BY proc_name
— total_logical_reads desc
— last_execution_time desc
— last_logical_reads desc
— last_worker_time desc

If you click on the query plan in the results, you will get the query plan for the whole stored procedure displayed.
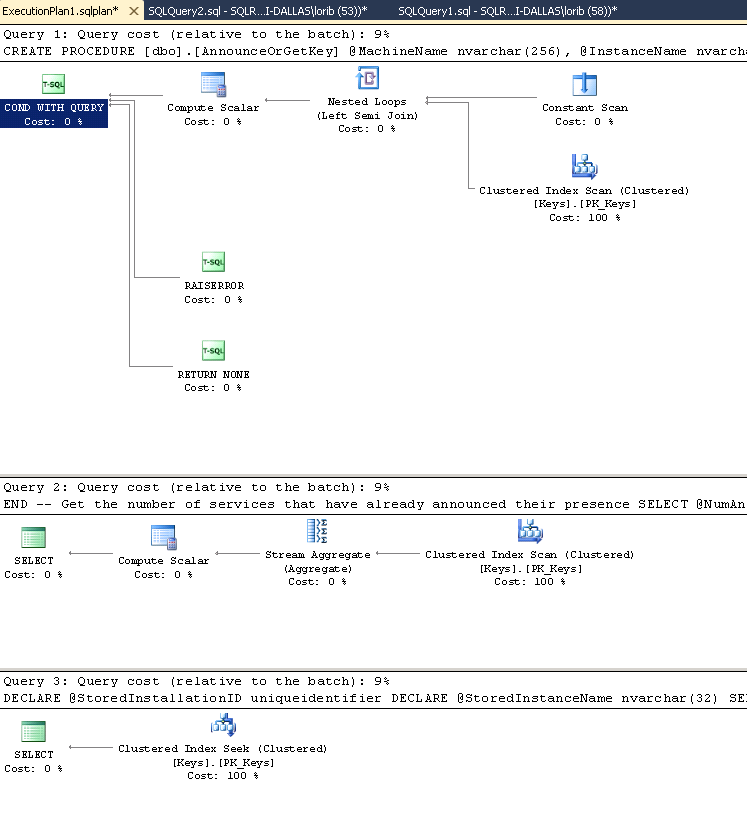
While this can be a large execution plan to sift through, it can be helpful when it is difficult to recreate all of the temporary tables and calls to other objects that can be created in a stored procedure. Many times the inability to accurately create temporary objects does make it difficult to troubleshoot a specific poor performing part of it but this query should help you get around that.
I hope this is helpful to you. Enjoy!
For more information about blog posts, concepts and definitions, further explanations, or questions you may have…please contact us at SQLRX@sqlrx.com. We will be happy to help! Leave a comment and feel free to track back to us. We love to talk tech with anyone in our SQL family!